Sending Profiler to Firefly
There are several ways to activate the profiler:
- From the Developer Tools menu
- Using a keyboard Short key
- As an INI entry
- Starting the Profiler
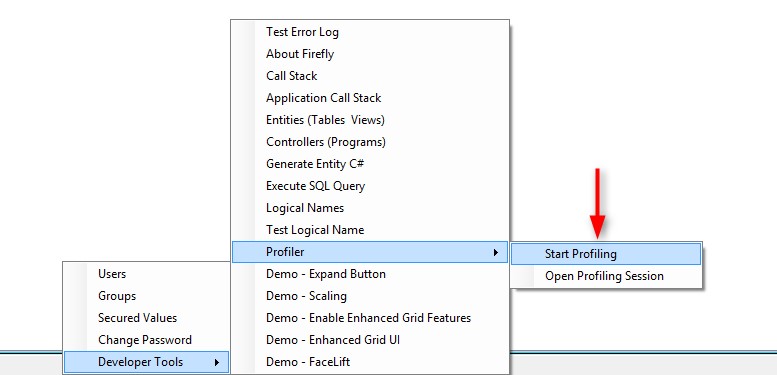
While the application is open, Right-Click on the status bar:
Developer Tools -> Profiler -> Click Start Profiling, or use the keyboard shortkey: Ctrl+Shift+P
Run the process
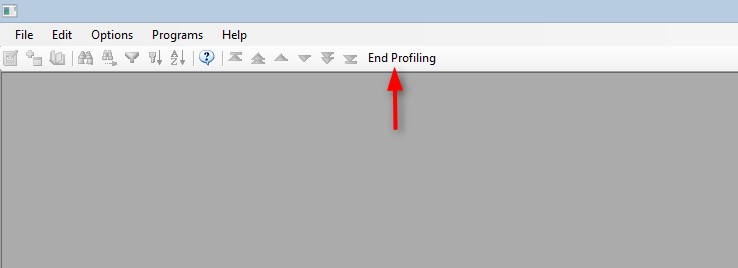
- End the Profiler
Once the process is done, click End Profiling in the toolbar menu or use the keyboard shortkey again: Ctrl+Shift+P
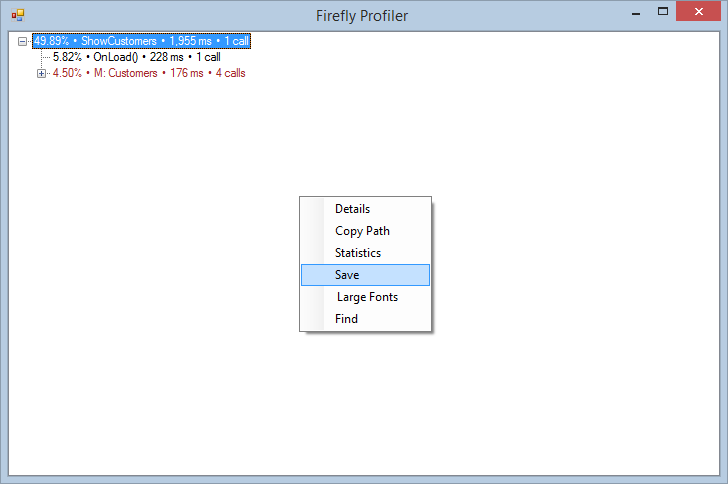
- Saving the Profiler
Right-Click on the results screen will bring a context menu with 6 options.
Click Save ,specify the path and file name and send us the file.
Profiler settings in the INI
To start the Profiler for the Web or without using Developer tools, Simply add an entry to the INI file in the [MAGIC_ENV] section:Profiler= c:\temp\myfile.prof
Or as an argumant from the command line:
/Profiler= *c:\temp\myfile.prof
Notice that a Profiler for the Web will create a file for each request.
- The Profiler is part of the migrated solution but you can also download it from here:
http://doc.fireflymigration.com/fireflyprofiler.html - For more information on the Profiler, please visit:
http://doc.fireflymigration.com/using-firefly-profiler.html
Help us improve, Edit this page on GitHub
or email us at info@fireflymigration.com